Line of sight calculator: mast height, dead ground and coverage
Six pages on this site assert that range is not coverage and that terrain decides. This line of sight calculator for dead ground is where that claim can be checked. This is the page where you can check it, or show that it is wrong.
- Observed arc, first unbroken run
- —
- Total ground visible within range
- —
- Dead ground within range
- —
- Share of nominal range covered
- —
This calculator needs JavaScript. The relationship it demonstrates is set out in full under fixed masts against mobile patrols, with worked figures.
Method: mast height, terrain and dead ground
A point at distance d is treated as visible when the straight line from the sensor head to the ground at d clears every piece of terrain between them. In practice the profile is walked outward and the elevation angle to each point compared with the largest angle seen so far: a point is visible only if its own angle is at least as high as everything before it. Ground inside the nominal range that fails this test is dead ground.
The terrain profiles are synthetic and fixed, not survey data. They exist so that the same geometry can be seen against different ground, and they are stated rather than hidden because a calculator whose inputs are invisible is a black box with a number in it.
Curvature is off by default, which is the convention behind every other figure quoted on this site, so the two agree. Switching it on subtracts a drop of roughly d²/2R — about five metres at eight kilometres — and always shortens the arc. Atmospheric refraction, which acts in the opposite direction and typically recovers part of that, is not modelled at all.
One consequence is worth stating before it looks like a contradiction. The worked figures quoted elsewhere on this site — a 12 m mast observing 4.1 km of an 8 km nominal range — come from the specific profile drawn on those pages. The same mast on the gently rolling profile here returns a different answer, and on broken upland a much worse one. That is not an error in either place. It is the entire claim: the sensor is identical and the terrain decides, so a coverage figure quoted without naming the ground it was measured on cannot be checked by anybody.
Reading the result
- The first unbroken run matters more than the total: coverage in three disconnected pieces is not the same asset as coverage in one
- Watch what doubling the mast height does — it is consistently less than doubling
- On the flat profile, coverage approaches the nominal range. On the broken one it does not approach it at any height
- The share of nominal range covered is the number that almost never appears in public description
What this calculator does not model
Everything that makes a real installation harder than geometry. It says nothing about thermal crossover, fog, rain or seasonal foliage; nothing about whether the sensor can resolve anything at the distance it can see; nothing about the radio link that decides whether a platform can report from where it stands. Each of those subtracts from the figure here, none adds to it.
Read the output as an upper bound on a good day, which is what a geometric drawing always is.
What the coverage figure is actually for
Not for planning an installation — the profiles are illustrative and no real stretch of border is one of them. It exists to make a single relationship legible, because that relationship is the one almost every public account of these systems gets wrong: coverage is a property of the pairing between a sensor and a piece of ground, and neither half determines it alone. Reading that in a sentence is easy to agree with and easy to forget. Watching the arc fail to grow when the mast doubles is harder to forget.
It is also a way of checking a claim you meet elsewhere. If a report quotes a system covering a stated distance, the useful question is what ground it was covering, and the second useful question is what share of the nominal range that represents. A system covering half its nominal range on rolling terrain is behaving normally. One quoted as covering all of it is either standing on a plain or being described by somebody quoting the specification.
Everything this line of sight calculator leaves out subtracts. The geometry in a line of sight calculator for dead ground is the ceiling: weather, resolution, crossover, foliage and the radio link each take something off it, and none of them gives anything back. A figure that already looks marginal on this drawing will not be rescued by better equipment, because nothing in the drawing is a property of the equipment.
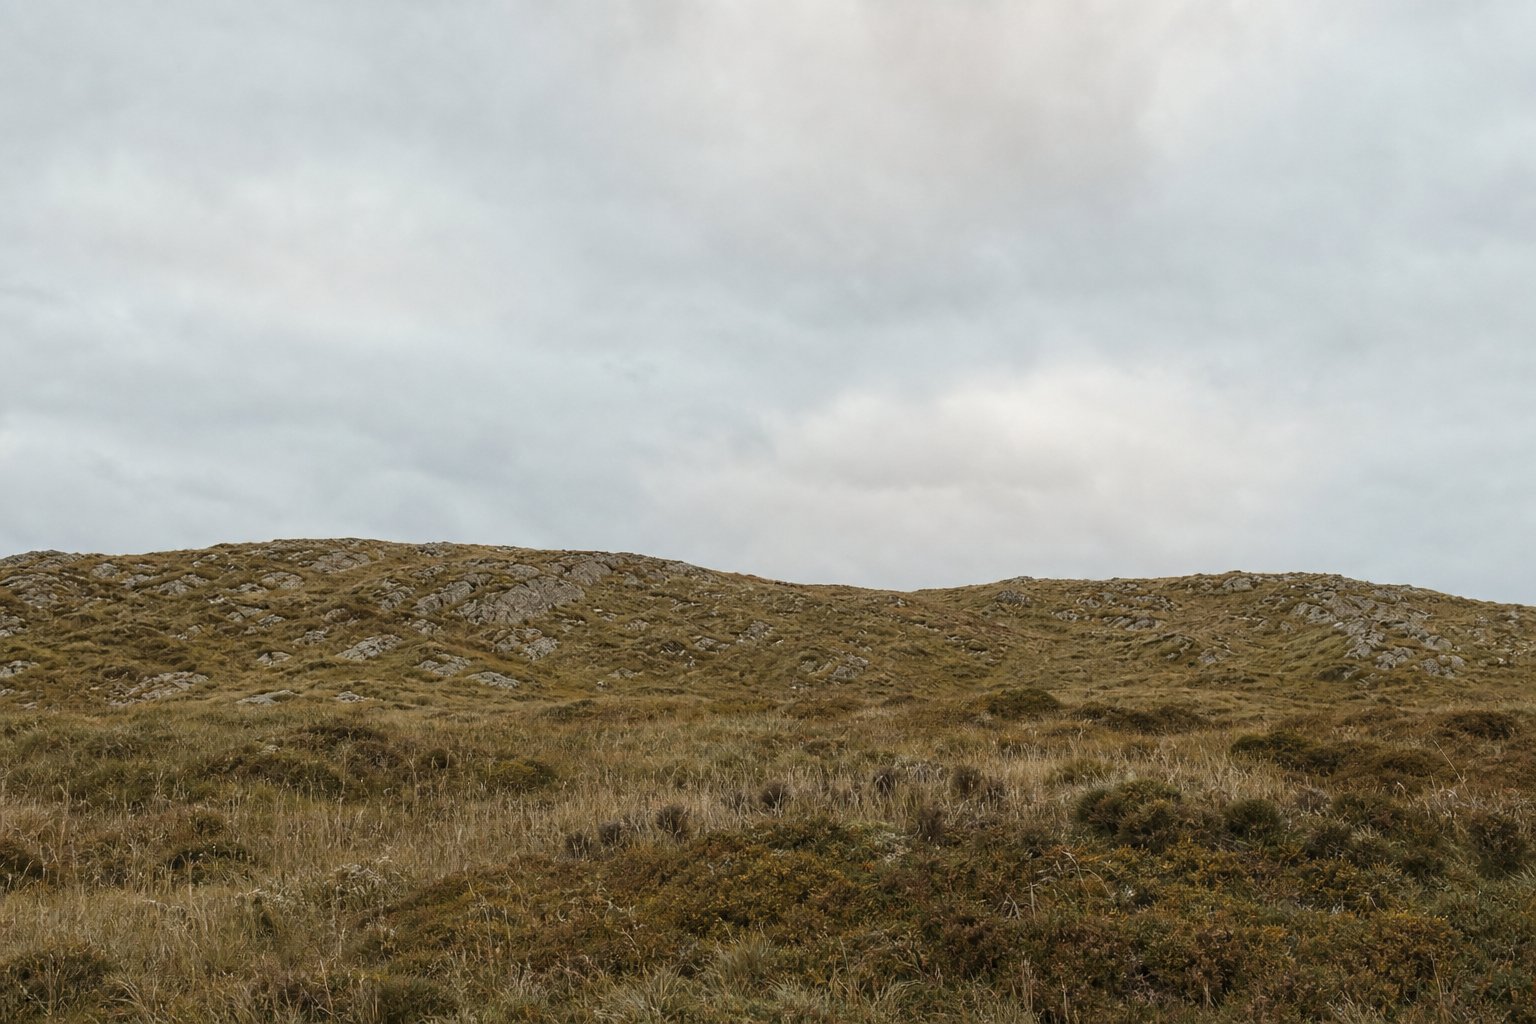
Questions about the line of sight calculator
What does this line of sight calculator actually compute?
Which points along a terrain profile are visible from a sensor at a given height, using plane geometry. A point is visible if the straight line to it clears every piece of ground in between. Everything else inside the nominal range is dead ground.
Why do the results differ so much from the sensor’s stated range?
Because range and coverage are different quantities. Range describes the instrument; coverage describes what it can see from where it stands. On broken ground the gap is routinely a factor of two, which is the point this calculator exists to let you check rather than take on trust.
Does it include the curvature of the Earth?
Only if you switch it on. The default is plane geometry, which is the convention the figures quoted elsewhere on this site use, so the two agree. Curvature always shortens the arc — about five metres of drop at eight kilometres — and switching it on shows by how much on your profile.
Can I use this to plan a real installation?
No. It uses synthetic terrain profiles, not survey data, and it models none of the weather, vegetation or sensor behaviour described elsewhere on this site. It is built to show how the geometry behaves, not to produce a figure anyone should rely on.