Border sensor comparison: range, conditions and the limitations
Three border sensor comparison tables, built to be read across rather than down. Nothing here ranks anything; the useful information is in which column is empty.
Border sensor comparison: sensing channels by range
Read this one across a row and then down the last column. Every channel listed works; what separates them operationally is what defeats each, and whether the things that defeat one also defeat its neighbour. Where two channels share a defeat, pairing them buys much less than the table suggests — the argument behind sensor fusion.
| Channel | Returns | Independent of | Defeated by |
|---|---|---|---|
| Thermal (LWIR) | apparent temperature contrast not an image of a person | light, illumination | thermal crossover, fog and heavy rain, wet surfaces, glass |
| Daylight optical | a picture; recognition at close range | nothing much | darkness, fog, canopy, anything between |
| Ground surveillance radar | range, bearing, motion a track, not an identity | light, temperature | terrain, rain clutter, wind-moved vegetation |
| Seismic line | a trigger and a rough position | light, weather, foliage | livestock, nearby traffic, soft or frozen ground |
| Acoustic line | a trigger and a signature class | light, foliage | wind, traffic, aircraft overhead |
Platforms compared
The second table compares what carries the sensor rather than the sensor itself. The column that matters is the last: each platform's coverage is a different kind of quantity, and comparing an area with a rate — which most side-by-side tables do silently — produces an answer that means nothing.
| Platform | Buys | Gives up | Coverage is |
|---|---|---|---|
| Fixed mast | continuity, comparable returns, no field crew | any choice of viewpoint, ever | an area, fixed at commissioning |
| Unmanned ground vehicle | choice of viewpoint, closes dead ground | continuity; not watching while moving | a rate, bounded by transit time |
| Fixed-wing aerial | endurance, ground swept per sortie | cannot hold a position | a rate, bounded by endurance |
| Rotary aerial | station keeping, vertical launch | endurance, wind tolerance | an area, for tens of minutes |
| Tethered aerial | continuous power, indefinite station | mobility; needs road access | an area — compare with a mast |
Conditions
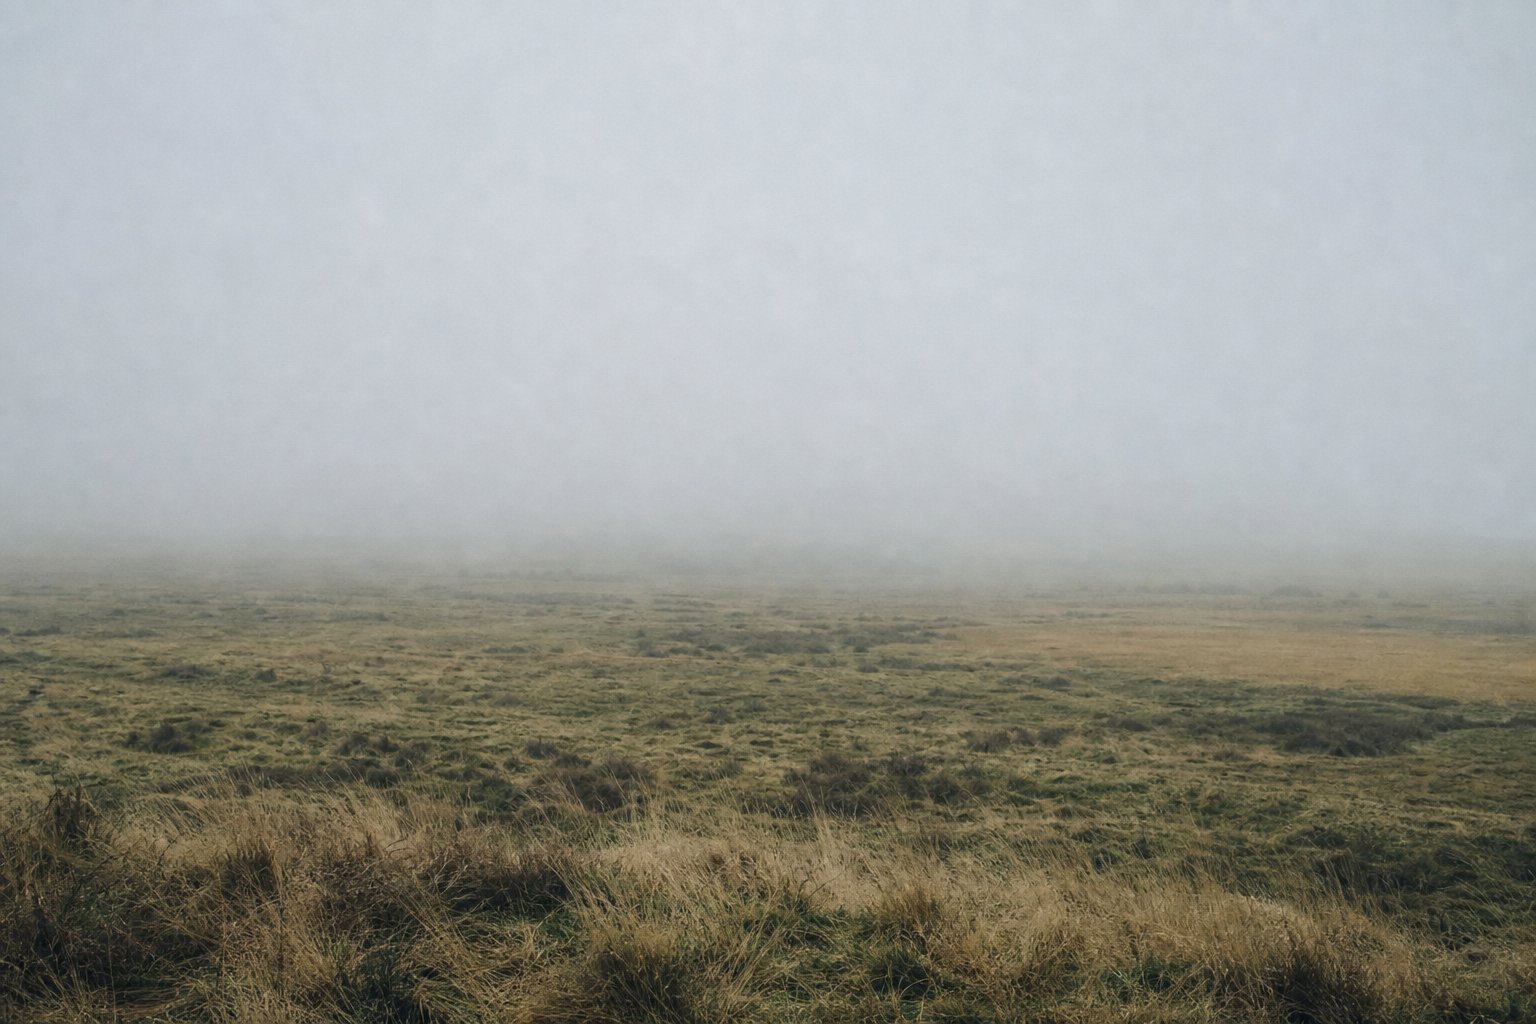
The third table is the shortest and the one that changes most claims. Each row is a condition that occurs routinely on a European land border, and each column says what it does to a channel that is otherwise working perfectly.
Nothing in it contradicts a specification, and that is the point. A figure measured in clear air stays true in clear air; it simply stops describing the night the condition arrives. Fog is the plainest case — it shortens a thermal channel, blinds a daylight one, and leaves a radar return largely alone, while no published number moves anywhere.
Read the rows as an argument for combining channels rather than as a fault list. A design that leans on one physics inherits that physics' blind spots whole, which is why the condition that defeats one column is so often the one another column shrugs off.
| Condition | Thermal | Radar | Buried line |
|---|---|---|---|
| Fog / heavy rain | range shortened, unevenly | clutter competes with returns | unaffected to degraded |
| Thermal crossover | contrast collapses entirely | unaffected | unaffected |
| Wind in vegetation | little effect | false tracks | false triggers via root movement |
| Full summer canopy | blocked from above | blocked and cluttered | unaffected |
| Frozen ground | contrast often improves | unaffected | transmission changes; thresholds drift |
How to read these tables, and the limitations they carry
- Read across a row first. A channel is defined by its whole row, not by its best cell.
- Look for shared defeats. Two channels stopped by the same thing do not cover each other.
- Check what kind of quantity a coverage figure is before comparing two of them.
- Nothing here is ranked, because ranking requires a specific stretch of ground.
None of these tables contains a product, a supplier or a price, and none is a procurement document. They exist so that a reader meeting a claim elsewhere — a range, a coverage figure, a comparison — can tell whether the claim is the kind of thing that could be true.
Where these figures come from
Every cell is one of three things, and the difference matters more than the value. Some are taken from a public document and are attributed to it. Some are conventional design ratios — the relationship between detection, recognition and identification, for example — which are properties of how these systems are specified rather than measurements of any installation. And some are calculated here from stated geometry, in which case the method is given so the figure can be recomputed rather than believed.
What no cell is, anywhere in this section, is a field measurement. This site does not put sensors on hills. Where a table needs a number that only fieldwork could supply, the cell says so instead of borrowing a plausible one from a brochure — which is why several rows read as qualitative where a reader would prefer a figure. A qualitative cell that is honest is worth more than a number whose origin cannot be traced.
The border sensor comparison tables are also deliberately short, and their limitations are the point of them. A comparison grid grows very easily to a size at which nobody reads across a row, and reading across the row is the only way to use one correctly. Each table here fits in a screen for that reason, and each covers one question rather than trying to be the single table that settles everything.
Questions about these comparison tables
Can these border sensor comparison tables be used to choose a system?
No, and they are not built for it. A border sensor comparison shows which quantity binds each channel, what its limitations are and what defeats it, so a reader can tell whether a claim is plausible. Choosing a system requires a specific stretch of ground, a specific budget and a specific operator, none of which a general table contains.
Why are there no product names or figures per model?
Because a model-by-model table would be a procurement document, which is outside what this site does, and because the figures would come from supplier material rather than from measurement. The rows compare physics, which is stable, rather than products, which are not.
Why is "defeated by" the widest column?
Because it is the one that decides deployments and the one specifications leave out. Every channel here works; what separates them in practice is what stops each of them, and whether the things that stop one also stop another.